
The Anatomy of a Cup Contender
The Ottawa Senators entered the 2013-14 season with a ton of hope. After all, the "rebuild" was officially over after a playoff series win against the Montreal Canadians, and management traded for 30-goal scorer Bobby Ryan in order to strengthen the team's top-6. This trade, along with the budget concerns surrounding the team, essentially gave the Sens a 2-year window to work with - 2 years before Spezza, Ryan, and a host of others would become UFAs.
However, things don't always go according to plan, and this season has been a disappointment to say the least. In an attempt to understand where the team needs to go from here, I decided to examine many of the "cup contenders" for this season: the Los Angeles Kings, the San Jose Sharks, the St Louis Blues, the Chicago Blackhawks, the Boston Bruins, the Pittsburgh Penguins, and the New York Rangers. Although "anything can happen" once you make the playoffs due to the presence of luck, these 7 teams have been widely regarded as the favourites to win the Stanley Cup this year, and by the end of this article, you should see part of the reason why these teams are in the upper-echelon in the National Hockey League.
This article will be quite lengthy, and will first look at some boxscore numbers -- traditional ways to evaluate a team. Secondly, we'll examine each team's play in 5-on-5 situations, before moving on to special teams. We'll end with a look at the size, age, and health of these teams.
Part II of this series will look at the drafting and development of each team, and will also briefly look at each team's cap situation.
Traditional Numbers
I've called this section "traditional numbers" because all of this information can be easily found via NHL.com's team stats page and have been traditionally used to evaluate teams. Numbers included are: goals/game, goals against/game, shots/game, shots against/game, PP%, PK%, hits, and faceoff %. I've also included their league rank in brackets for ease of comparison.
Note: All of these tables are sortable! Just click the category and it will sort it for you. A huge thank you to Derek from Fear the Fin for helping me do this.
As we can see, 5 of the 7 teams have prolific offenses - in the top-10 league wide. We'll examine the Kings and Rangers further when we look at the 5-on-5 totals, but even a preliminary look at their shot rate highlights a bit of bad luck. On the opposite spectrum are the Blues and Penguins, who seem to have better luck converting their shots into goals. The Senators actually match up well on the offensive side, and I strongly believe that offense is not the problem here.
Defensively, all of the cup contenders are in the top-10 league wide, with only the Bruins and Rangers falling out if we switch to shot totals. The Senators get a participation medal on this front.
I hope the Hits totals help clear up some misconceptions that some still have regarding whether "hitting wins hockey games". With approximately the same number of teams in the bottom-half as there are in the top-half, it doesn't seem like it has anything to do with success. There's also the risk of scorer bias by whoever is counting all of the NHL's real-time stats at each rink, which is also the problem with totals like shot blocks and shot location. Although this is also the case with shot totals, the sheer number of them helps in this matter.
Faceoff totals are interesting, with 6 of the top-7 teams in the top-10 league wide. Faceoff percentages are constantly brought up by broadcasters and analysts, and most successful teams are good at faceoffs due to being deep down the middle. As an aside, the main reason why I don't pay attention to faceoff totals too much is due to the fact that shot differential numbers are much more indicative of offensive zone time than faceoff numbers are, so I'd much rather look at shot attempt totals after a game, rather than faceoff numbers.
5-on-5 play
5-on-5 play is the situation that NHL teams spend the most time in, and in fact, around 75% of all the shots taken over the course of an NHL season takes place during 5-on-5 play. Thus, a lot of the "advanced" stats focus on this particular type of play. Of interest to us is a stat called Fenwick Close. Fenwick is simply shots on goal +/-, but includes missed shots. It differs from Corsi, which includes shots on goal, missed shots, and blocked shots. The "Close" at the end refers to Fenwick while a game is within +/- 1 goal or tied in the first two periods, and just tied in the third period. Chris Boyle at Habs Eyes on the Prize created this fantastic graphic last year, which illustrates that teams with a Fenwick Close of greater than 50% have a 75% chance of qualifying for the playoffs, and teams with a Fenwick Close > 55% have a 25% chance of winning the cup.
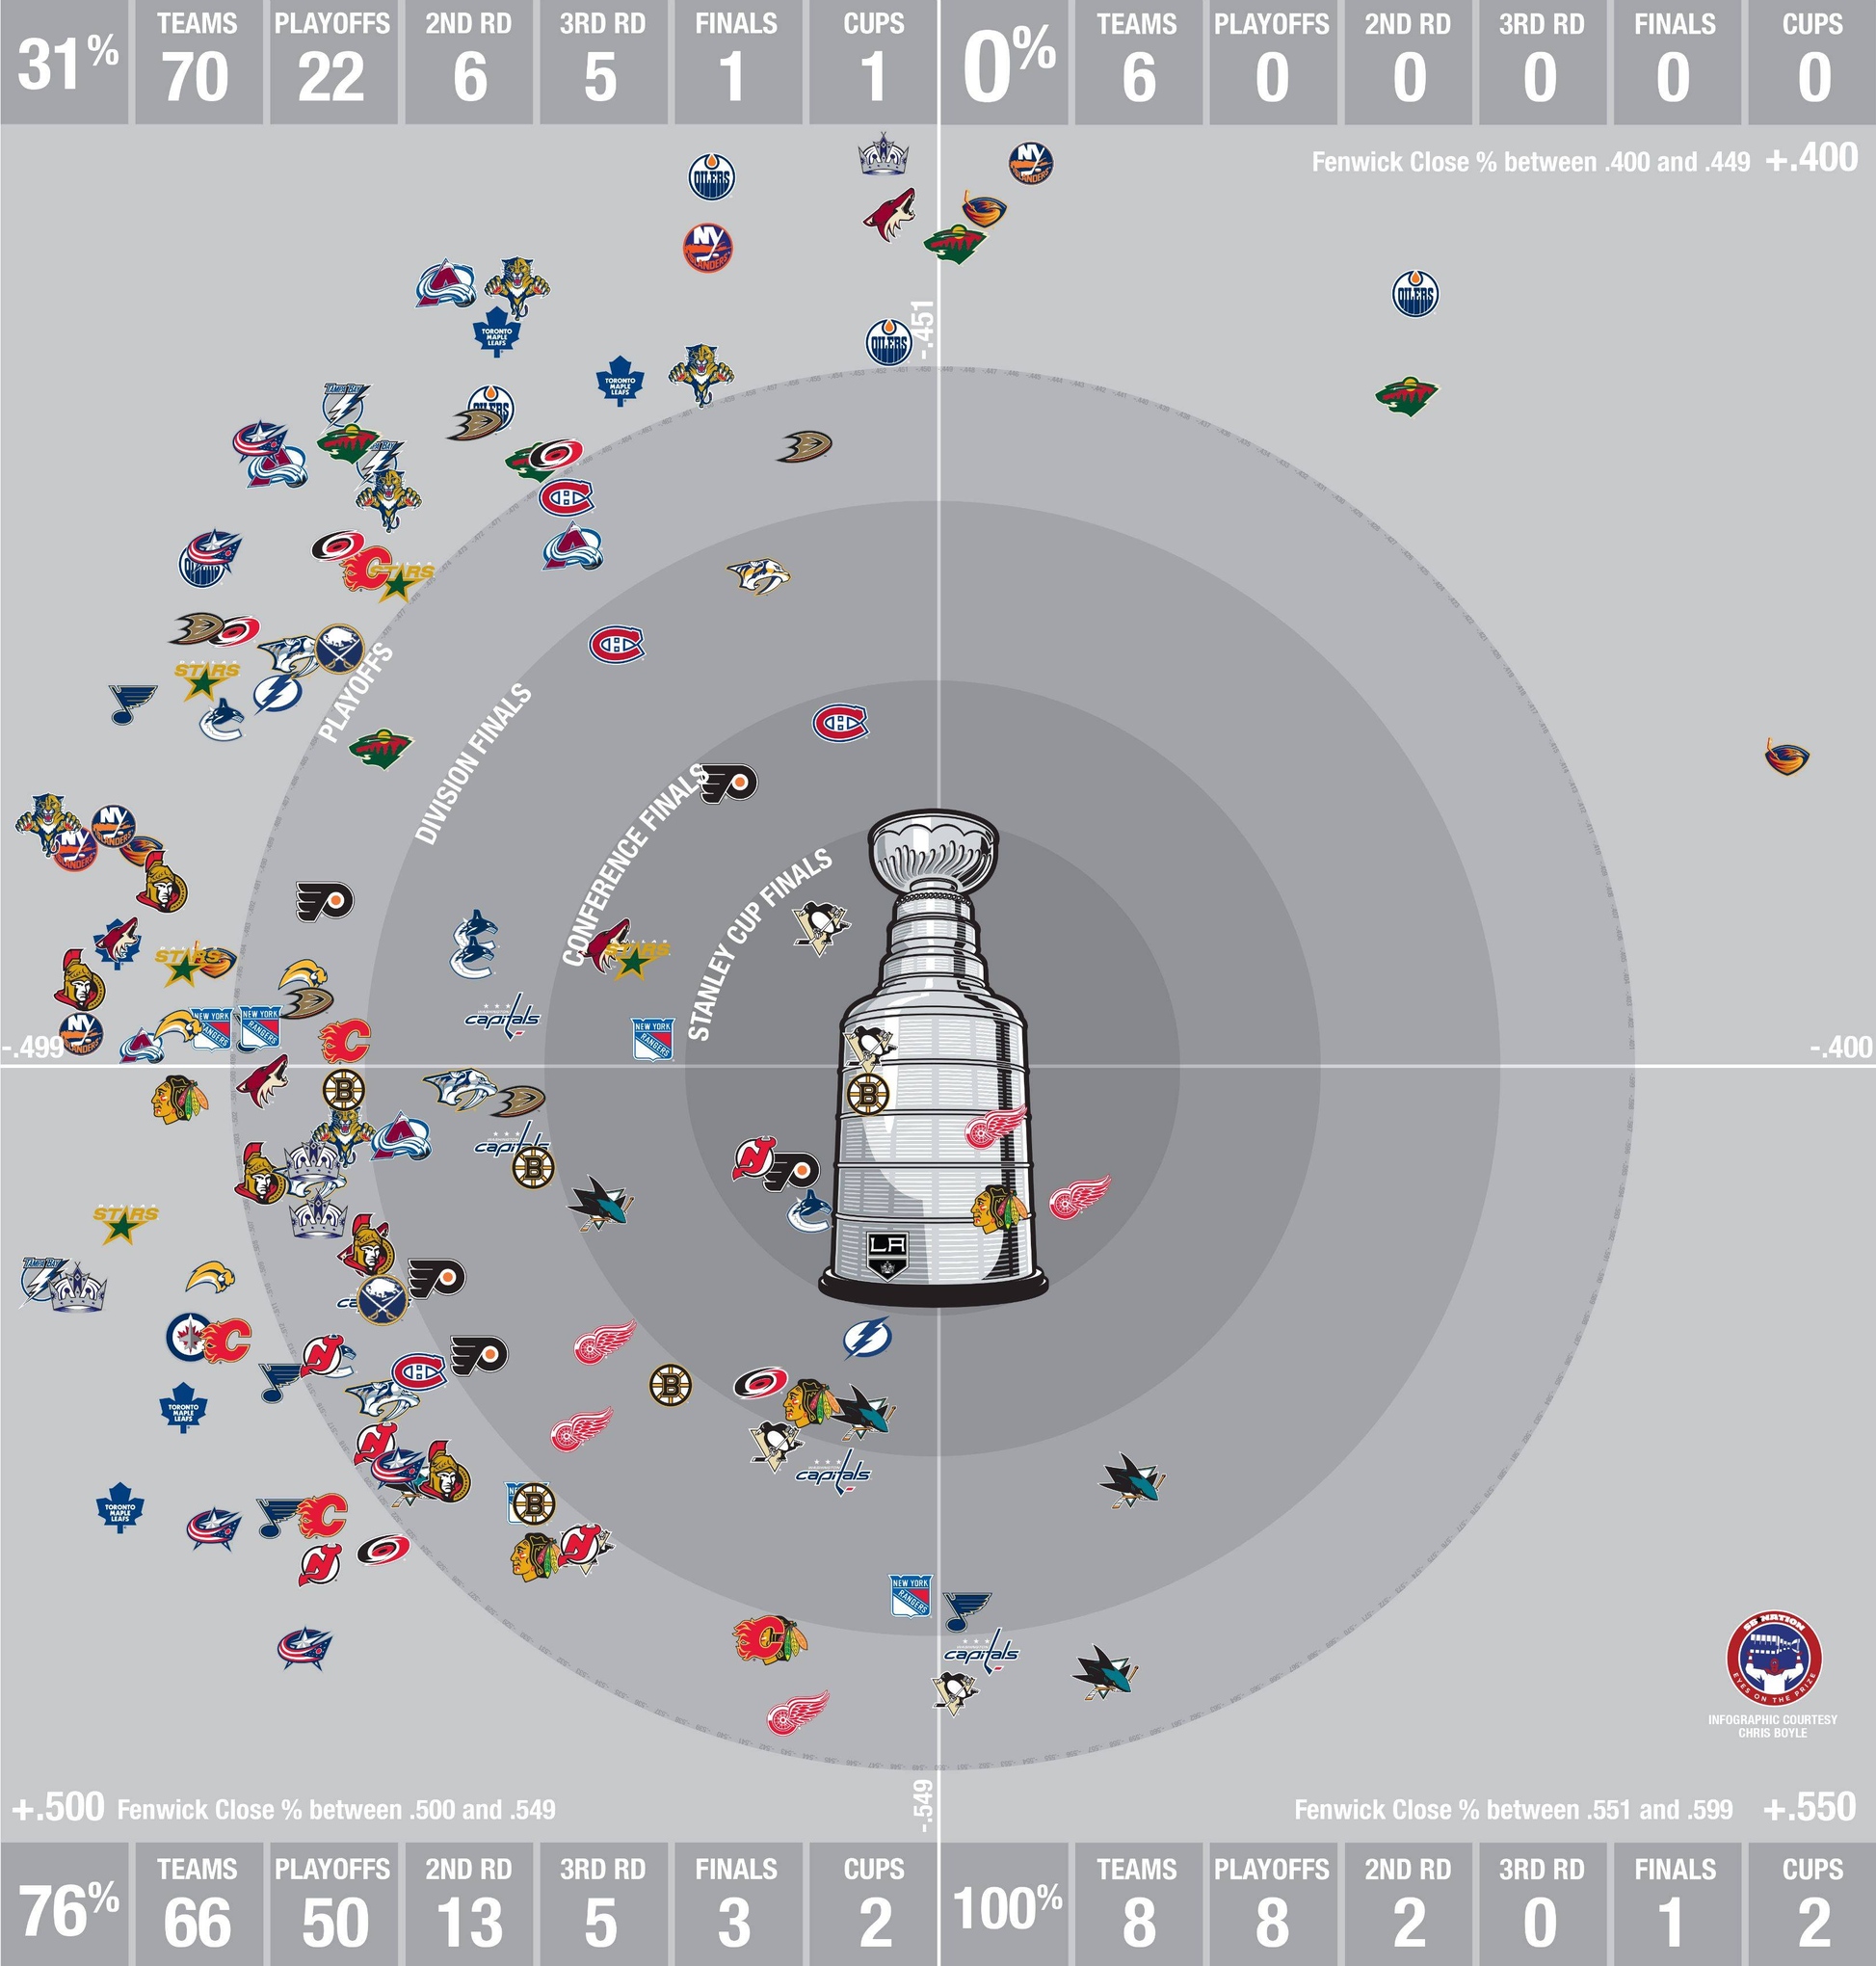
Only 6 of the 16 teams currently in playoff position are sub-50% Fenwick Close [Colorado, Philadelphia, Montreal, Phoenix, Minnesota, Toronto], with the latter 3 very close to dropping out of the wild card spot they current possess.
In the table below, I've included Fenwick Close as well as team shooting %, goaltender save %, goals for %, and PDO, which is a great measure of luck (with the league average being 1000).
Note: the average goaltender sv% during 5-on-5 play is ~ 0.923%, and the average team shooting % is around 7.75% at 5-on-5 this season. Down Goes Brown has a great introduction to on-ice percentages here; all data in the table from the 5-on-5 or score close section from ExtraSkater.
Hey, would you look at that. If you ignore the Penguins, all of the other Cup contender teams hold the 1-7 spot in Fenwick Close. The New Jersey Devils currently hold the 5th spot, but have a putrid on-ice shooting % of 6.0%. I love looking at 5-on-5 play because it helps separate the "real" teams from the "fake" ones. Who do I think is for real? The Kings, Sharks, and Blackhawks all have outstanding possession numbers and normal looking PDOs (read: aren't getting that lucky). Boston is easily the beast of the East, with scary GF% numbers that are kind of being helped along by an above-average shooting %, but not by that much. Although the Bruins sport the highest PDO on the back of the league's highest save %, Tuukka Rask is arguably the best goalie in the NHL and their possession numbers would help make up ease the effect of their save percentage regressing to league average.
I'd worry a bit more about the Blues and the Penguins. The Blues are an interesting team, as they're clearly talented but are also blessed with the 2nd best shooting % in the league, which tends to decrease come playoff time by around 1%. Their possession numbers are the 2nd lowest compared to the other contending teams (esp. the Western teams), so they'd probably be affected by the sh% drop more than the others. The Penguins are battered injury-wise (we'll look at that in a bit), so their possession numbers don't surprise me. When examining elite teams + their depth, Tyler Dellow found that Pittsburgh suffered more than the others, mainly due to the weakness in their bottom-6. Due to these reasons, I wouldn't consider Pittsburgh a strong Cup contender -- but they're still a threat due to having 2 of the best players in the world.
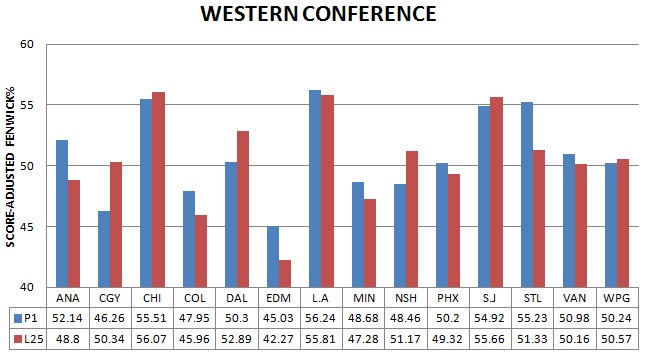
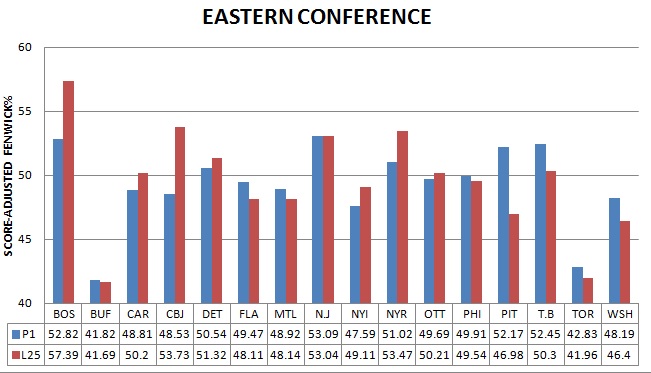
Travis Yost published a piece earlier in the week with each team's score-adjusted Fenwick (SAF) numbers, a measure of puck possession that's a little different than Fenwick Close (bigger sample size).
His results below favour the conclusions I just made with respect to LA, San Jose, and Chicago being the strongest Western teams, and Boston being the strongest Eastern team. Pittsburgh is definitely fading, with only a 49.54% SAF over their last 25 games. The East is definitely weaker overall, but New York seems like a good bet as the 2nd strongest team in the conference. His results, combined with what was found here by Tyler Dellow, are the exact reasons why I didn't include Colorado or Anaheim as Stanley Cup contenders. Both have middling possession numbers and league-high PDO numbers, which don't warrant their current position in the standings.
Special Teams
Analyzing special teams play is a bit different than analyzing even-strength play, and there's still a lot more our current analytical models can do to try and fairly incorporate special teams play. We're going to be using shot rates to analyze each team's special teams play, as it's much more repeatable than shooting percentage, just like at even strength. Patrick D. from Fear the Fin has done some fantastic work on the topic, and found that for the powerplay, Fenwick For/60 is the best predictor of powerplay success (measured via Goals For/60). For the penalty-kill, goaltender save percentage and Corsi differential/60 are predictive of future success (GA/60), but are less powerful predictors overall compared to our powerplay measures due to heavier regression to the mean. I've also included penalty differential [PP opportunities - times shorthanded] for curiosity.
Note: Penalty Differential numbers were taken from NHL.com and were added up manually by me. If interested, the league totals are here. All other stats were from ExtraSkater's PP or PK page. The average shooting % during the powerplay this year is 12.3%. the average goaltender save % during the penalty kill post-lockout is 0.875 annually with little variance.
Alright, let's break this down, starting with the PP. The Kings, Rangers, and especially the Sharks are getting a bit unlucky with the percentages, as their PP conversion rate (PP%) is putrid compared to their top-10 Fenwick For/60 numbers (FF/60). This is mainly due to the shooting %'s of these teams on the powerplay, with all three teams below average. On the opposite spectrum, the Hawks, Bruins, and Penguins are all performing better than their FF/60 would indicate, thanks in part to again - their shooting % being 1-2 points higher than the league average. The Blues are by far, the biggest benefactor of shooting %, as their FF/60 is the only one of the cup-contenders to be in the bottom half of the league, but instead find themselves with the 9th best powerplay.
Penalty kill success is determined largely by the goaltender's save percentage, and as Ottawa fans know oh-so-well, it can mirage the actual aptitude of the penalty killers. In general, goaltender save percentage heavily regresses to the league average, and if you want to make a near-surefire bet, always bet against a goaltender with a PK SV% of above 0.900. Many of the cup contenders are middling and slot anywhere from 5-19 in the league based on PK%, Corsi Differential (For - Against)/60, and PK SV%. The only team that's really riding the percentages are the Pittsburgh Penguins, who boast the 2nd best PK in the league, thanks in part to a league leading 0.912 PK SV%. Looking at their 24th ranked Corsi differential number, I'd predict that things aren't going to be as rosy for the Penguins come the playoffs.
When I look at the Senators PK numbers, all I can do is muster a half-sigh/half-laugh, as it's practically complete flip from last year. The Sens are getting unlucky, with a PK SV% well below average, but a top-4 Corsi differential. I'd expect that part of this is due to the sheer number of PP opportunities the Sens bestow on other teams, as they rank dead last in that category with a -44 rating.
Although intuitively, we know that penalty differential matters as it's never good to handicap your team, the cup contenders are spread out from the top-half (Sharks, Rangers, Blackhawks) to the bottom-half (Bruins, Kings, Blues). Regardless, I'm sure every coach would love to be the Sharks, rather than the Bruins, in this case. Ottawa's number is laughable.
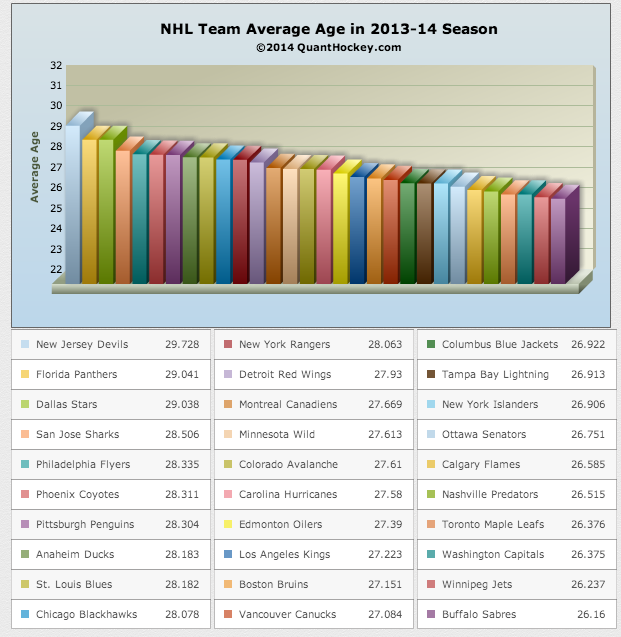
Age
The folks over at QuantHockey visualized the average age of every NHL team this season nicely. As shown below, only the Kings and Bruins are in the younger-half of teams in the NHL. The Senators also show their youth here - which is expected, fresh off a rebuild.
Age can be tricky to analyze, as from a development standpoint, it's mainly the teams in the bottom-half who are young due to the fact that they've traded away their veteran players in an attempt to rebuild. By that logic, it makes sense that many of the contending teams are older, with established NHL players making up a large chunk of their core. To examine this further, I went through and found the average age of the top-6 forwards and top-4 defensemen using ice-time (via ExtraSkater). Why ice time instead of points? Remember, it's not just scoring that is relevant to winning a Cup - you need offense AND defense. I'd expect coaches to play their best players the most, so ice-time seemed like the best bet.
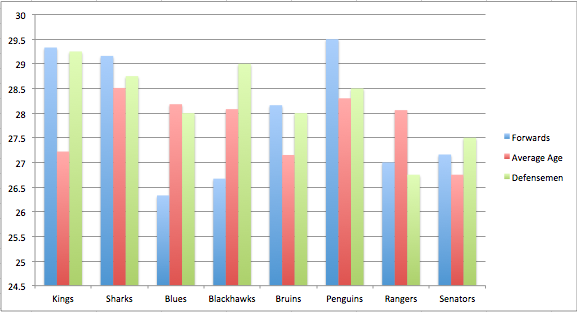
Note: These numbers are pre-trade deadline roster changes
My assumption seems to fare okay here, as the "core" of most of these teams are made up of established NHL players, with their fare share of veterans - who move both the average top-6 forward and top-4 defenseman bars higher than the average age of the team. The Blues, Blackhawks, and Rangers forward groups look young, which bodes well for their future success as the players will spend more time in their prime, with respect to both scoring totals, and possession numbers.
The Senators actually have a fairly young core group of players, as although the average age of the forwards + d-men are greater than the average age of the team, we have to remember that the Sens average age overall is very young - especially when compared to the other contenders.
One final piece of information I wanted to look at with respect to team age is the number of players each team has in specific categories: U23, 24-27 (prime), 28-34, 35+. The only cut-off I used here was that the player would have had to play in greater than 50% of his team's games up until this point. Again, this is pre-trade deadline information.
(info from www.hockeydb.com)
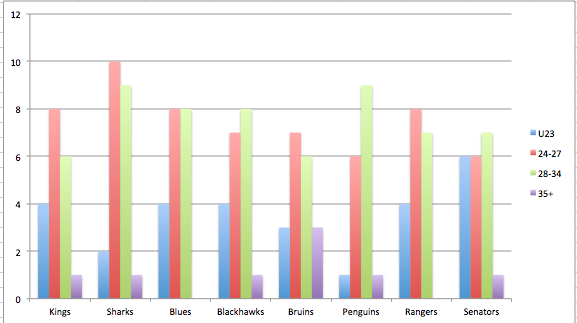
A lot of the Cup contending teams look the same, with around an equal number of players in their prime (24-27) and more veteran guys in their UFA years (28-34). Many have 0 or 1 35+ players, with the exception being Boston. This graph and the previous one allow for a nice juxtaposition, comparing the ages of the top-6 forwards and top-4 D with the number of players on each team in a certain age class.
Size
There's a common theory that "bigger is better" when it comes to NHL players (or life in general), but as we showed with the hits total way back at the start of this article, that may not always be the case. Recall that there were ~ equal amount of the cup contending teams in the top-half of the league when it came to hits as there were in the bottom half. What about the average size [height + weight] of the players? Over at the Globe & Mail, James Mirtle compiles yearly size numbers and found that at the start of the season, the average height of the NHL player was 6'1.3 and around 204 lbs. A full breakdown of the totals for the start of the 2013-14 season can be found here, but I've extracted the relevant info for our use.
Again, we don't see much of a trend here, as there's ~ the same amount of teams in the upper-half of the league in height and weight as there are in the bottom-half. Ottawa actually ranks as one of the bigger teams in the league! I'm sure that part of the value with acquiring players with size is to fit your style of play - the Kings and their strong forechecking game. However, the Bruins are another team with a devastating forecheck, and their numbers don't match up that similarly. I'd bet that the speed at which the team converges in on you and their positioning to break up the breakout by the opposing defenseman imposes a bigger challenge to the opposition than the size of the player.
Health
The best injury analysis comes from LW3H over at Springing Malik, who painstakingly goes through injury reports, cap totals, and time-on-ice numbers to give us the great visuals we'll see below. As a quick primer, CHIP (Cap Hit of Injured Players) is often used as the primary indicatory of the value lost to a team by injury or illness to a player [Graph 1]. In case you don't think cap hit is a good indicator of value, there's also AMIP (Average Minutes of Injured Players), which uses time-on-ice instead [Graph 2]. Both have some limitations, as all stats do, but they're great for a comparison between teams in order to see who has been hit the hardest by injuries. The numbers below are totals after 70 games played this season.
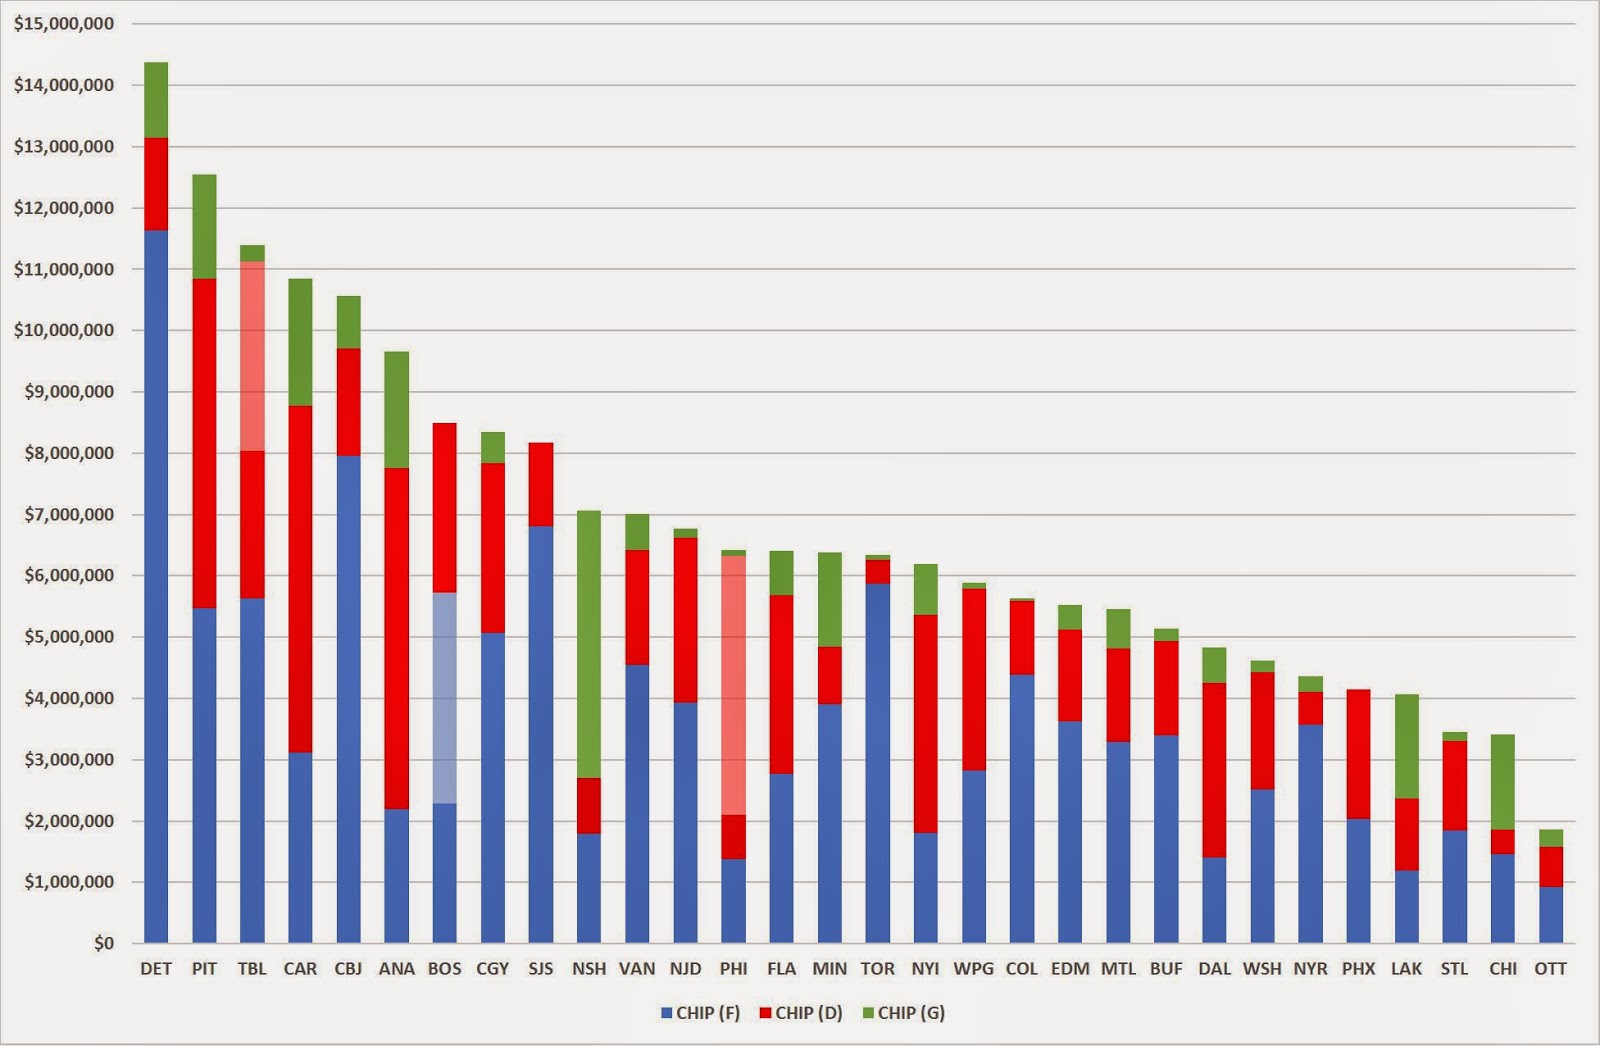
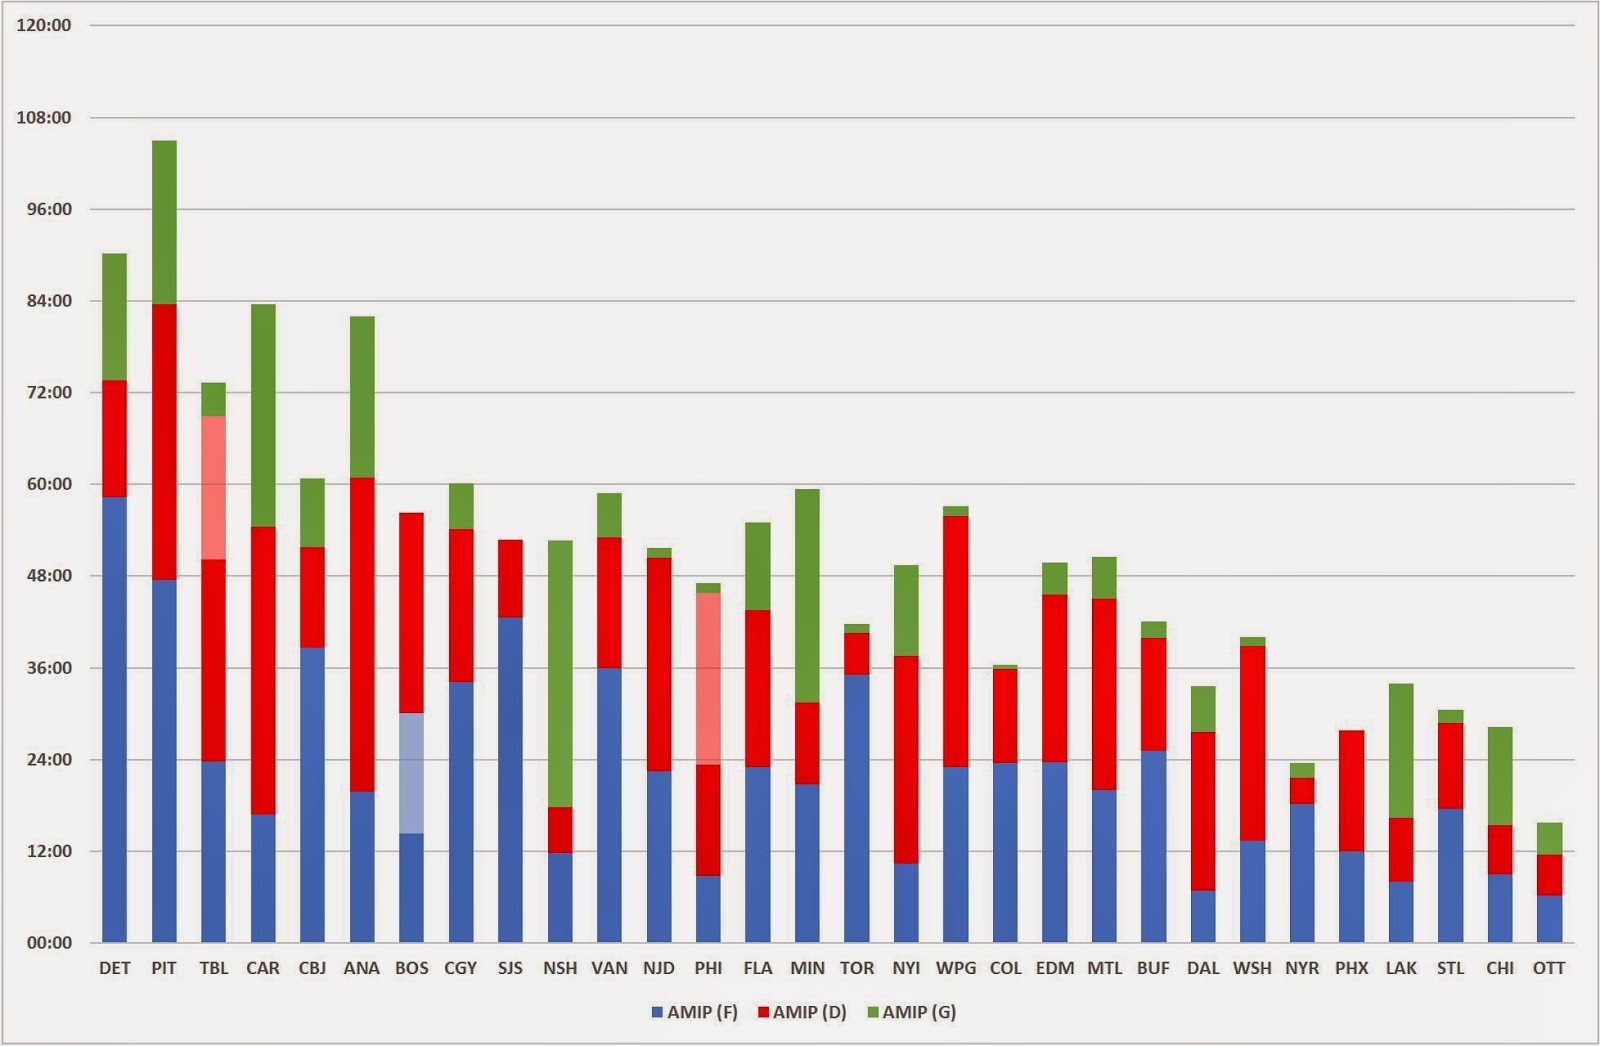
As we can see above, 4 of the cup contending teams are some of the healthiest in the league (right part of the graph). Pittsburgh has been ravaged with injuries all year, which partly accounts for their diminished possession totals. Boston has been relatively healthy, but these graphs account for Marc Savard's injury. San Jose has dealt with injuries to Hertl, Torres, and Havlat, but their depth at forward is outstanding and helps make up for 3 pretty big losses.
Ottawa has been the healthiest team in the league (by both metrics), which makes the disappointment of this season sting a little more, due to the fact that many thought Ottawa would be able to contend seeing as they had won a playoff round with many key players injured last year.
Conclusion
Firstly, I commend you for reading through this entire piece. Part of my goal with this was to give you, the reader, a comprehensive examination of the Cup contending teams, and only one link to bookmark, instead of splitting this up into parts. I hope the graphs helped split up the text in order to make it an easier read.
Secondly, some key points. Although cup contending teams are usually in the top-10 in both Goals For/game and Goals Against/game, shot-based metrics are a safer bet when trying to separate who the real contenders are from the "fake" ones. Fenwick Close is our best bet at determining which teams are likely to a) make the playoffs and b) do damage in the playoffs. A quick glance at 5-on-5 sh% and sv% numbers will let you know if teams are getting lucky, and when used in conjunction with possession metrics, help you determine which teams are likely to stay strong after their high sh% or sv% start to drop closer to league average.
For special teams play, FF/60 looks like the best indicator for future PP success, and CD/60 looks like the best bet for PK success. The key point here is that this is for future success.
Cup contenders are older than average, with a bulk of the players in their prime (24-27) or in their UFA years (28-34). Few teams have more than 1 player aged 35+. Young players (23 and under) certainly play a role on cup contenders, but overall, players in the top-6 forward group or the top-4 defense core are a little older than the team's average age itself.
Size does not appear to play a role in declaring a team a cup contender, and shouldn't be emphasized as a key contributor to NHL success. Possession definitely looks to be more important, and GMs would do well to explore the market inefficiency that currently exists - cheap-possession players. Lastly, on average, cup contending teams are usually the healthiest, which is common sense. The data above just serves to add further proof to that claim.
What does that mean for the Ottawa Senators? I'd take away a lot of good things, actually. The Sens offense is right up there with many of the cup contending teams, with their possession numbers being solid enough to have them within striking distance. The Senators have a higher % of U23 players and players aged 24-27 than cup contending teams, and I'd assume as once these players gain more NHL experience, they'd be more ready for a shot at the Cup. If this season hadn't confirmed it for you already, the defense stinks, and it's what currently separates the Sens from being contenders, along with special teams and penalty differential. Instead of emphasizing size on defense, Sens management would do well to look for puck movers to get the puck to the already-great offense fast in order to spend more time in the offensive zone.
In the second (and final) part of this series, we'll examine the drafting and development record of these organizations while briefly touching on their cap situation.
Thanks for reading!


