
Season Simulations with Pip
A model for predicting seasons and which teams will make the playoffs using Pip
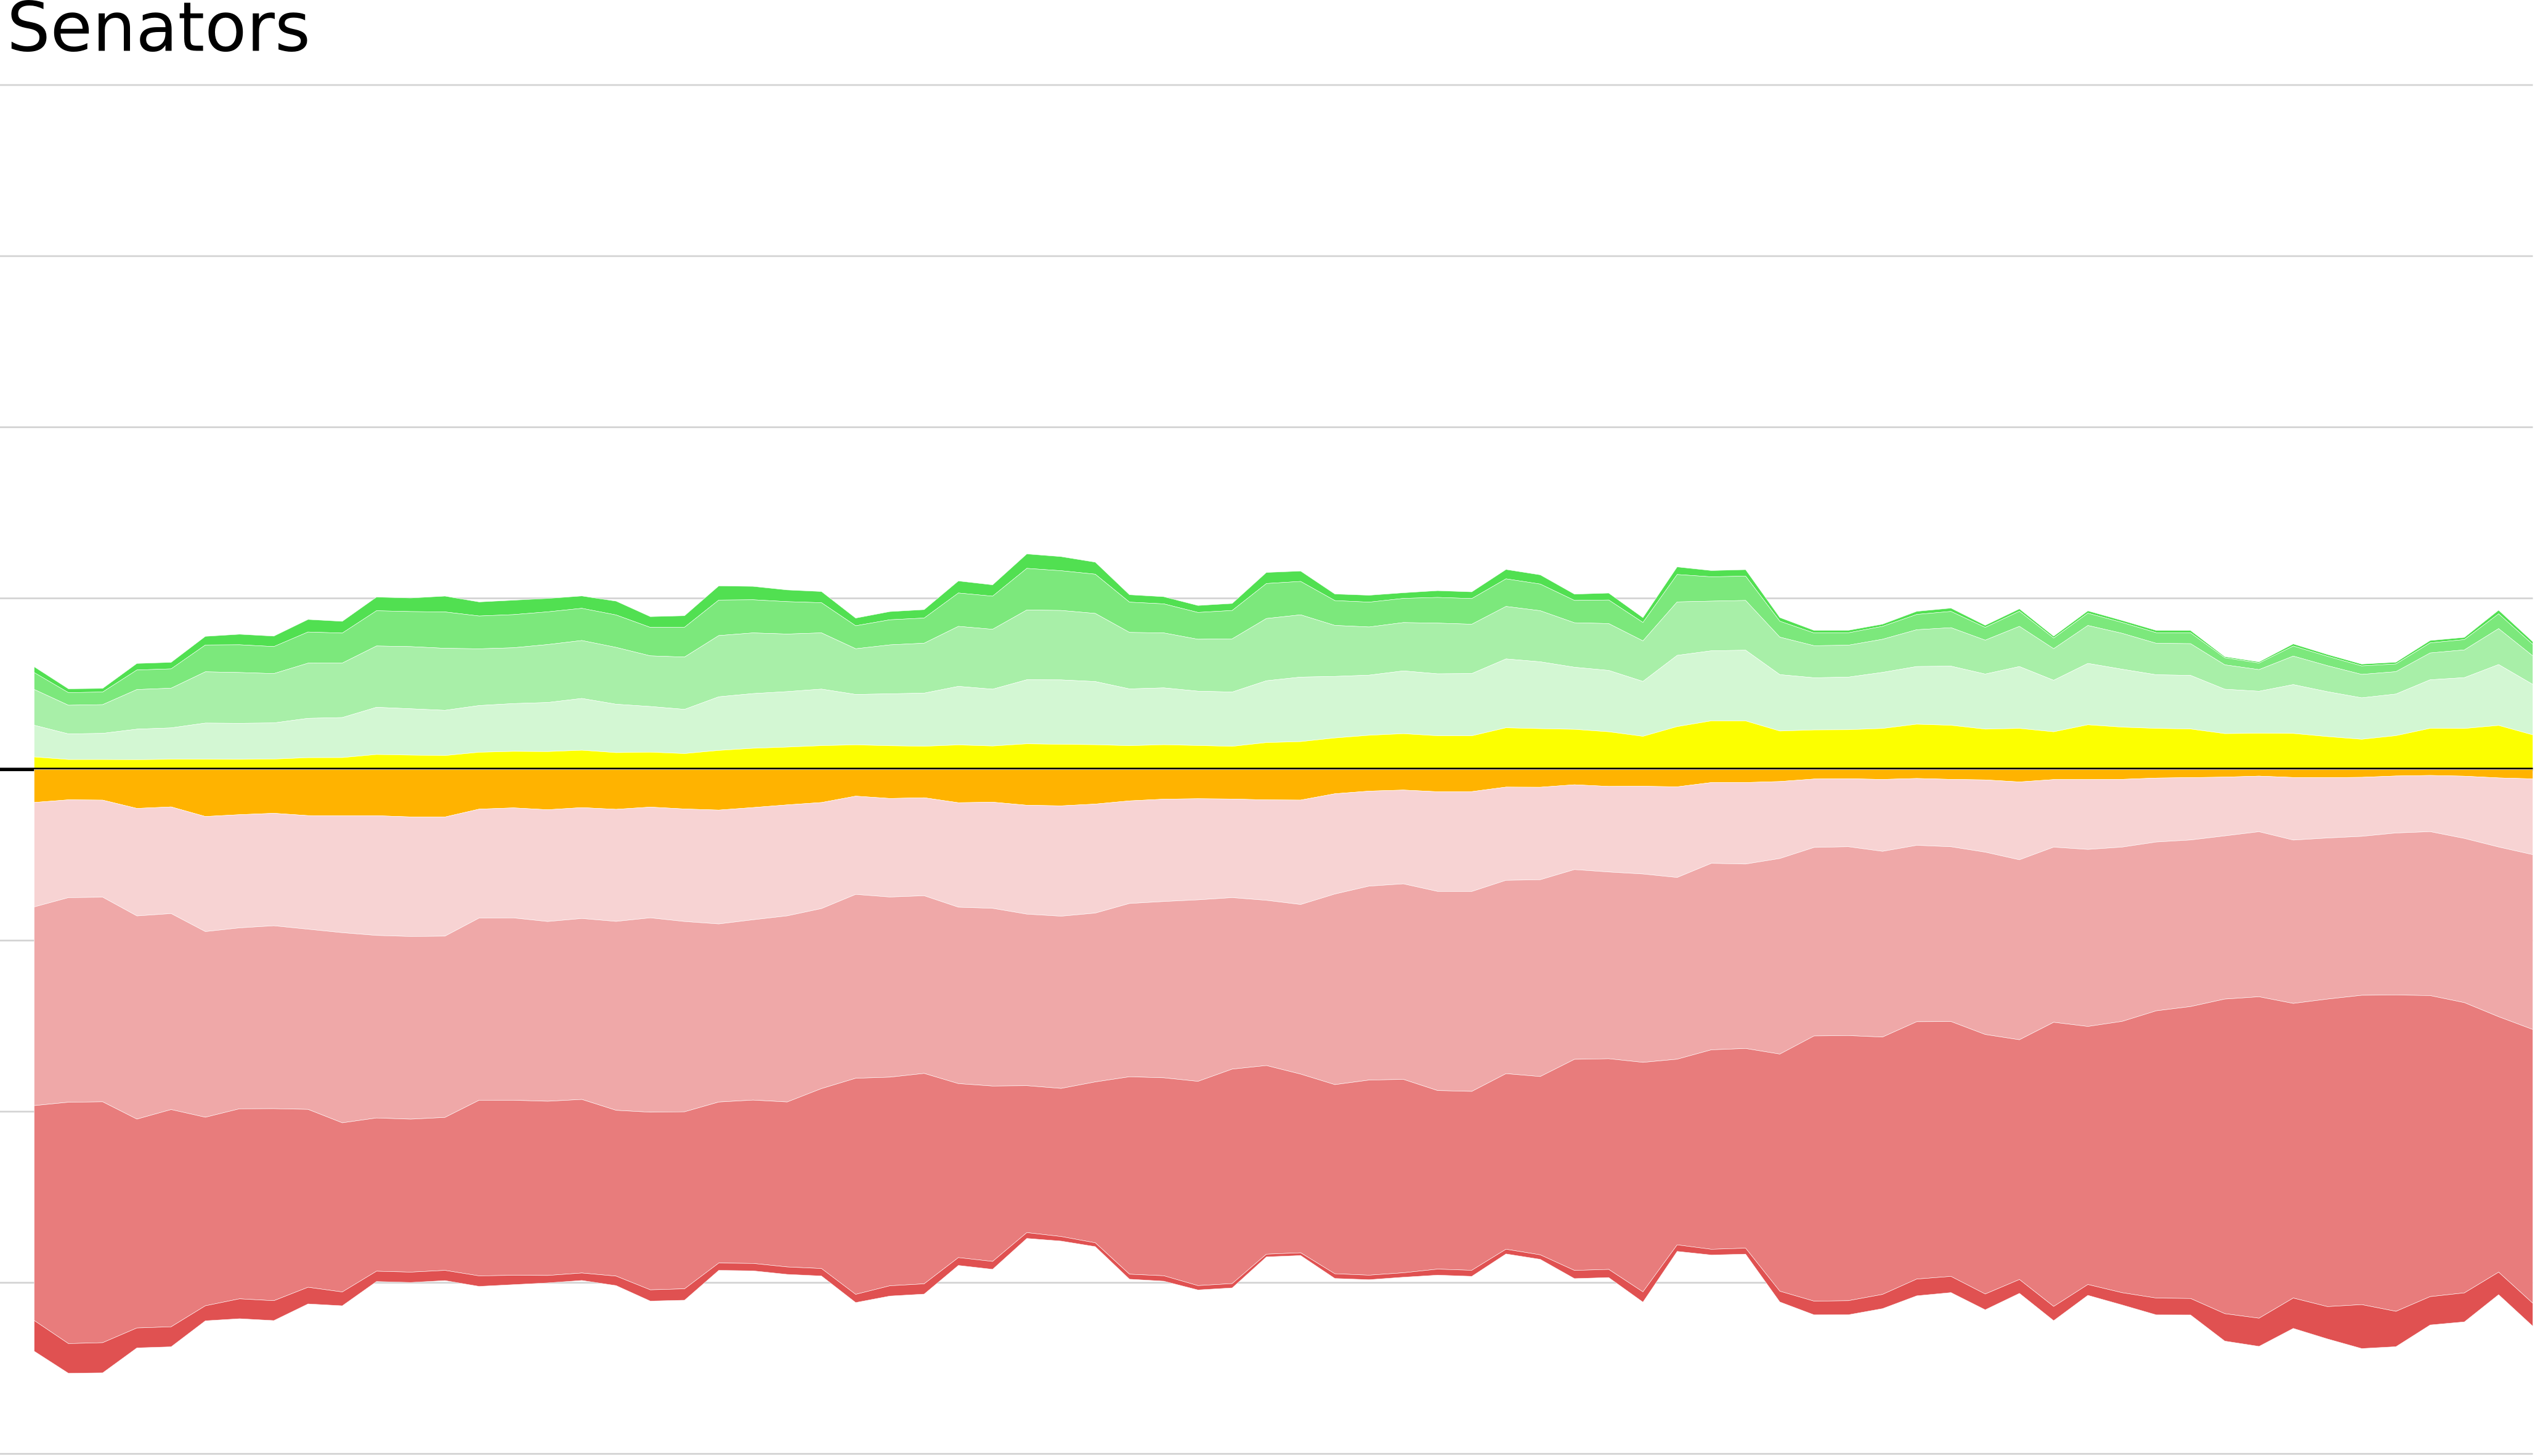
I have built a handful of models for predicting upcoming games, and I use them to predict all sorts of things. The most interesting thing in the mind of most fans, though (certainly in my mind) is: where will my team be in the standings at the end of the year? Especially: will my team make the playoffs or not? Well, to tease you, here is a graph which shows where my model has predicted the Senators will end up as the season has worn on:
2014-2015
I'll explain how to read this (bleak) prediction for the Senators chances in due course; first I should give a full accounting of the model I use to make the graph.
The primary model which I use for all the stuff I post on the interwebs is called "Pip". I like to tell people that it is acronym for "Possession is prescient", but, in fact, it is named after a friend of mine, whose name is Pip. She is a wonderful person who does not get enough credit, and so I named a model after her, although she has, harshly speaking, nothing to do with it.
Pip is a logistic regression model whose output is the probability that the home team will win a given game. Logistic regression is the appropriate regression for predicting probabilities, but it can be technical and non-intuitive to learn, even for people who are familiar with linear regression. (The word 'logistic', incidentally, comes from the 'logistic function', which varies between 0 and 1, which is appropriate for modelling probabilities. The word 'logistic' was used for this function by Verhulst, who gave no justification for it whatsoever, and apparently everybody just followed along blithely. Oh well.) The core of the trouble in understanding comes from the fact that, once you have a very high chance of winning a game, it is very hard to increase your chances of winning still furher. On the other hand, if you are almost certain to lose, you don't have to improve much to raise your chance of winning from, say, 10% to 20%. This non-linearity is the root of much confusion.
There are four model inputs, namely:
- Score, venue, and schedule adjusted 5v5 fenwick for, per game, for the home team, over the past 25 games;
- Score, venue, and schedule adjusted 5v5 fenwick against, per game, for the home team, over the past 25 games;
- Score, venue, and schedule adjusted 5v5 fenwick for, per game, for the away team, over the past 25 games;
- Score, venue, and schedule adjusted 5v5 fenwick against, per game, for the away team, over the past 25 games./
Each one of those things is a mouthful, but they can collectively be summed up as "average ability to generate shot attempts and suppress shot attempts in the last while". The various adjustments are all ways to better measure the central question of "How much did this team control play? [relative to what we would expect, given the score, and where and whom they played.]" For those who are curious, I've written before about schedule adjustment here and about score and venue adjustment here and here
If I were making the model again today, I would also train a model using corsi instead of fenwick and compare, but I make a point of maintaining one 'reference' model for each season which I do not modify during the season.
I am a big devotee of model simplicity, so some might wonder why I decide to measure offence and defence separately, instead of combining them into one number, say, into a percentage. This is possible and defensible, but I find I get better results by not doing this. (Watch for another article by me with an inflammatory title like "Why percentages are bad", where I discuss this in gruesome detail.)
I train my models using data from the 2007-2014 seasons, using NHL play-by-play data. These datafiles are not perfect, and although I've manually fixed one or two egregious errors (teams having two goalies in play for the same event, etc.) there are surely some errors which remain. I don't use the shot-distance indicators, which are the most suspect parts of the play-by-play files. I worry a little bit about including 2007-2008 data, since it seems so long ago now (and, strictly speaking, the rules are different now), but for now I still do. I have no qualms about omitting 2012-2013 completely when I feel that it is qualitatively different from the other years, especially when I'm testing something over 82 games.
The use of "previous 25 games" is surprising to some people; mostly they ask why I don't use more games in my sample of past performance, or even games from previous years. In fact, I've investigated using the past "n" games where n ranges from 0 to 82, and found the following (qualitative) behaviour:
- Taking n = 0 corresponds to not using any history, that is, treating all teams as the same. Training like this amounts to measuring home-team bias over the training data and gives a uniform prediction for home team wins of 54.7%. This is a better model than you might imagine.
- Taking n = 1 or 2 gives scarcely better results than n = 0. As n increases to around 12, the predictive power increases dramatically, so I never use samples of fewer than 12 games.
- As n increases to around 20-30 games, predictive power increases more slowly, reaching a broad plateau.
- After this plateau, predictive power slowly decreases as our sample gets larger and larger./
This is puzzling at first but suggests that looking at a team's performance more than 30 games in the past is considering a team that is not very similar to the team playing today -- roster moves (callups/demotions as well as trades) and coaching decisions (systems as well as ice-time allocations) are obviously important, but my intuition suggests that the most important factor is injuries, both incurred and healed. Looking back too many games is simply looking at a different team. Similarly, the nigh-impossible to model impact of off-seasons on roster, age, conditioning, and coaching makes looking at previous seasons generally detrimental. It's true that more data is always better, but we want more data about the teams that are about to play -- not more data about a different team playing with the same sweaters. So, Pip uses a 25 game window, and it's my general rule of thumb for taking team data to use exactly 25 games until I see some reason to use a different window.
Training a model with these inputs and outputs on the 2007-2014 seasons (excluding games for which the 25 game window is not available) gives the following coefficients:
| Home Fenwick* For: | 0.0402 |
| Home Fenwick* Against: | -0.0583 |
| Away Fenwick* For: | -0.0363 |
| Away Fenwick* Against: | 0.0456 |
Where 'Fenwick*' means Fenwick measured using the adjustments I detailed above. Since we are modelling the chance of a home win, we see that home teams who generate a lot of events and away teams that allow lots of events are positive, that is, the home team is more likely to win, as expected. Similarly, home teams that give up lots of events and away teams that generate lots have negative coefficients, that is, these things predict home teams that lose, again as expected. What is more interesting is the relative magnitudes of the coefficients. The home team coefficients are both larger than the road team coefficients, suggesting that the home team really does "set the pace" of the game, both for good and for ill. Also, the marginal value of an event against suppressed (~0.055) is about 50% more than the marginal value of an event for generated (between ~0.038). This corroborates both the coaches' old saw and the recent analytical work of Jen Lute Costella (@RegresssedPDO, see for instance here), among others, that defence wins more reliably than offence.
It's also worth mentioning what the model does not include. It doesn't include any special teams play. It doesn't include any goaltending, and it doesn't include any shooting ability. Not including these things explicitly in the model amounts to implicitly assuming that these things are equal among all thirty teams. This is obviously false, but accounting for them is surprisingly tricky. For now we mention the omissions and leave their discussion to another time and place.
Once you've got a model that works, what will you do with it? Predicting single games is fun and potentially remunerative but not especially social. My favourite task for Pip is to predict where a given team might end up at the end of a season. One way to do this is with so-called 'Monte Carlo' simulations, which inherit their name from the casino region of Monaco simply because they involve probabilities, like gambling does. In short, I simulate the remainder of the season, assigning each game as a home win or an away win, according to the probability given by Pip. I also randomly assign around 10% of the games to be overtime wins, and around 15% of the games to be shootout wins, to give the liberal sprinkling of spare winner points that the current broken point system so adores. Each simulation gives a different ranking of 30 teams, and, by taking enough simulations, we can get a decent measurement of the chance of a given team ending in a certain position.
For instance, let's return to the graph from the top of the article, showing the Senators finishing chances this year.
2014-2015
The x-axis shows the number of days since the season started. Each coloured stripe represents a divisional finishing place. The narrow dark green stripe at the very top, nearly invisible, shows the chance of finishing atop the Atlantic division. This has never been noticeable at any point this season. The next two green stripes show the chance of finishing seeded 2nd or 3rd in the Atlantic, sometimes as high as 5-10%. Finishing fourth is tricky; one can finish fourth and make the playoffs (shown in palest green) or one can finish fourth and fail to make the playoffs, if the two wild-cards are both from the Metropolitan division, this is shown in orange, below the line. Similarly, one can finish in fifth and make the playoffs as the second wildcard, shown in yellow, or one can finish fifth and fail to make, shown in palest red. Finally, the chances of finishing sixth and seventh are shown in darkening shades of red, with the ignominy of finishing eighth shown as a dark red ribbon along the very bottom. The total chance of making the playoffs is the height of the warm, pleasant colours above the axis, and the total chance of missing is the depth that the deepening reds sink beneath the axis. The Sabres prevent the Senators from taking 8th in the Atlantic in all but the most outlandish situations, but the most likely finishing spot currently appears to be seventh. Making the playoffs is by no means out of the question, but currently hovering at around 20% or so.
For an example with a bit more movement, here is the same graph for last year's Senators:
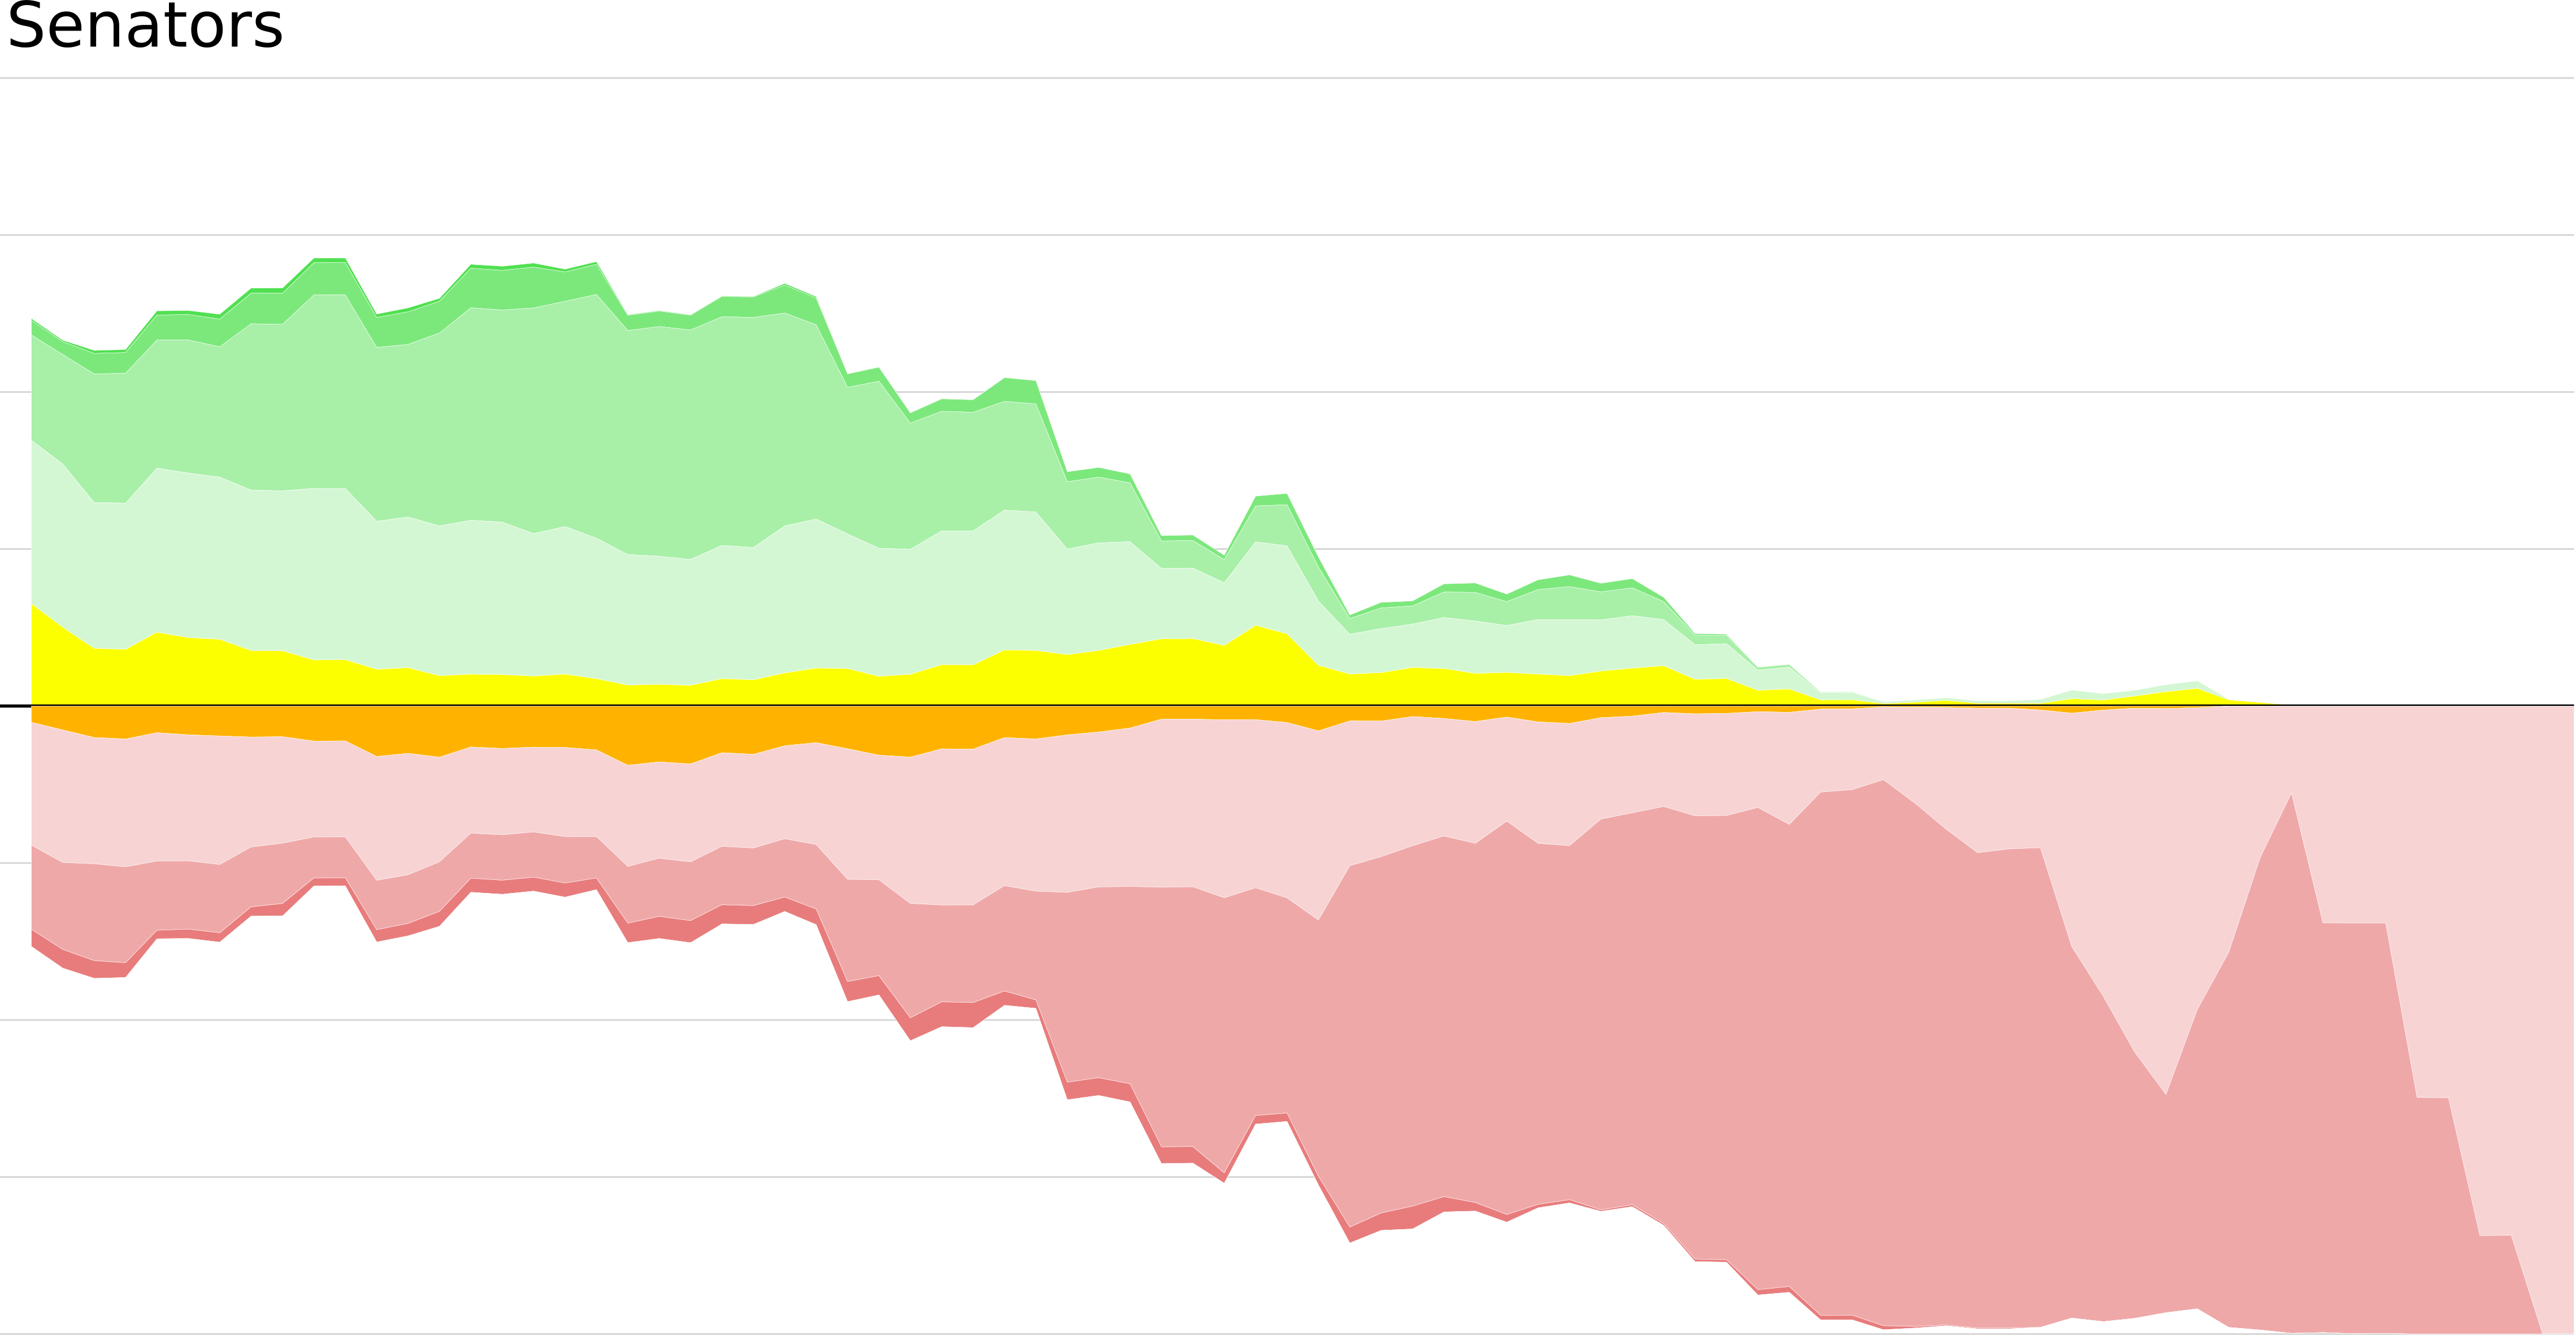
2013-2014
A third of the way through the season, the sens were in good shape, with third in the division looking most likely and a total chance of making the playoffs of around two-thirds. The slow decline through the middle section of the year opened up the lower placements, until they had no chance of escaping the fifth place that was their eventual fate. The late-season winning streak that energized the team is clearly visible as the chance of finishing sixth ebbed away, replaced by fifth.
Of course, you can do all sorts of things with a model once you've trained it, including calculating President's Trophy chances, first overall pick chances, playoff matchups, and so on.


