By the Numbers: Ottawa Senators vs. Pittsburgh Penguins
It’s been a long absence, but the Ottawa Senators are back in the NHL playoffs. Okay, it was only one season, but it had been a long, long time since Ottawa had gone a spring without playoff hockey (minus that pesky lockout). But now the Senators are back, and they’re picking up right where they left off: playing the Pittsburgh Penguins.
The Penguins, as you probably know, knocked off the Senators in the 2008 playoffs in a first-round sweep en route to a berth in the Stanley Cup Finals, where they would ultimately lose to the Detroit Red Wings. The Senators did basically the same thing a year earlier when they took out Pittsburgh in the first round, only to lose the Cup to the Anaheim Ducks in five games. Buoyed by not playing the Senators last season, the 2009 Pittsburgh Penguins went on to defeat the Red Wings and take back the Cup.
By now we’ve established a pattern: whenever the Senators and Penguins meet, the winner will ultimately go on to lose in the Finals to some Western Conference powerhouse. That’s why this series is so important, because it will decide who the runner-up for the Stanley Cup will be.
So how do the 2010 Ottawa Senators and Pittsburgh Penguins compare? Silver Seven breaks it down for you with plenty of detail and charts and such.
Goal scoring by period
First period
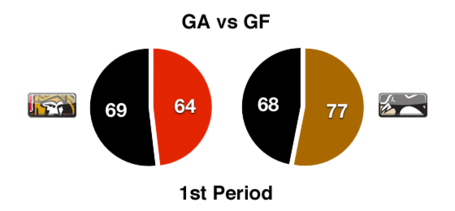
Both teams have virtually identical GA totals in first periods, but the Penguins have scored roughly 20% more goals than the Senators.
Advantage: Pittsburgh
Second period
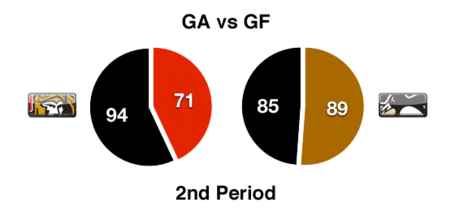
This one isn’t even close. Fewer goals scored and far more goals allowed makes the Senators easy prey in the second period.
Advantage: Pittsburgh
Third period
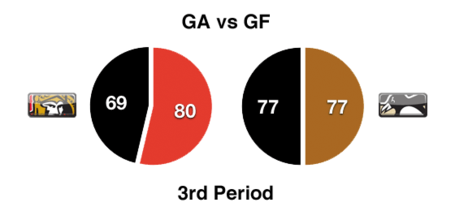
Significantly fewer goals allowed and a slight edge in goals for have the Senators slightly ahead in the third period.
Advantage: Ottawa
Empty net

Advantage: Ottawa, but not significantly
Forwards
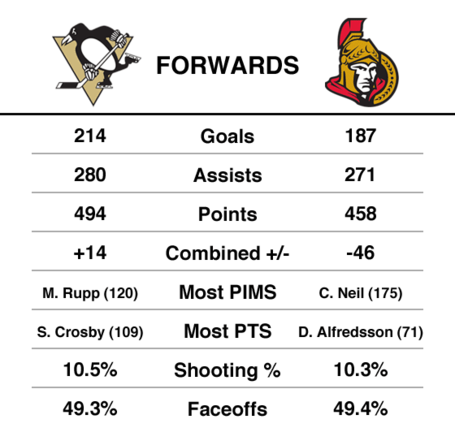
It’s no question that the Penguins have a deadlier offence than the Senators. Their leading scorer tied for second-overall in the NHL with 109 points, while Ottawa’s had 71. They produce more goals and more points, but the teams are about equal at shooting percentage and faceoffs. Being able to hang in with the Penguins in those extra categories might let the Senators stay in the game for awhile, but in the end the Penguins’ offence might be a little too much to match.
Advantage: Pittsburgh
Defence
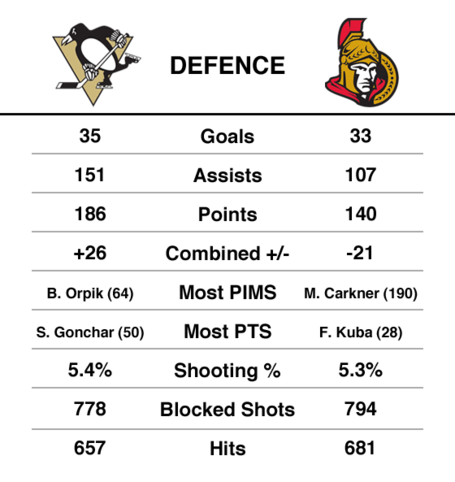
The Senators and Penguins have nearly identical offensive output in terms of goals scored, but Pittsburgh defencemen assist on almost 50% more goals than Ottawa defenders. Sergei Gonchar’s point total (50) is nearly double that of Filip Kuba (28) and Erik Karlsson (26). Kuba is injured, which means it’s Karlsson vs. Gonchar in the matchup of top offensive defencemen. Victory for Pittsburgh.
The blocked shots and hit totals are similar, but one statistic does stand out: Andy Sutton is 2nd in the NHL in shot blocking. Anton Volchenkov is 8th. Chris Phillips is 27th. The Penguins top shot blocker? Jordan Leopold, 29th. Shot blocking favours Ottawa, but overall this one still falls into the favour of the other guys.
Advantage: Pittsburgh
Goaltending
For goaltending we're going to compare players directly instead of as a collective whole, as goaltending is a much more individualistic position.
Starters
Their stats this season are similar, but Fleury gets the edge because he actually has NHL playoff experience. Fleury’s played nine playoff rounds in the last three seasons. Elliott has never played a minute of playoff hockey at the pro level.
Wild Card: Some goalies can raise their game to another level in the playoffs and some falter. We have no idea how Elliott will handle the added pressure, but he’s a streaky goalie and if he gets hot, he could (maybe, possibly) steal a game or two.
Advantage: Pittsburgh
Backups
Pascal Leclaire’s season has been an abomination, while Brent Johnson just signed a two-year extension. Neither goalie will likely see time unless their team is getting shelled, but Johnson is the more proven commodity.
Wild Card: Johnson recorded three consecutive shutouts for St. Louis in the 2002 playoffs and put up a 5-5 record with a 1.83 GAA and .929 save percentage. There’s no reason to think he'll come close to matching that, but if you need to call upon your backup in a crisis, Johnson's an underrated choice.
Advantage: Pittsburgh
Black Aces
Neither John Curry nor Mike "Not Martin" Brodeur has seen much playing time in the NHL this season, but Brodeur is 3-0 with a 1.00 GAA, and Curry let in five goals in the 24 minutes before being pulled in his only game this season.
Wild Card: Not Martin is a distant cousin of Martin Brodeur, so there’s a tiny bit of pedigree in his system. Pretty flimsy, even for a wild card, but the chances of either of these goaltenders seeing time is slim to none.
Advantage: Ottawa
Overall
Ottawa has three goalies who have never played a minute in the NHL playoffs. Heck, they've never even sat on the bench during the postseason. Pittsburgh has a back-to-back Stanley Cup finalist and a backup who put together three straight shutouts in 2002. Yeah, this is a tough one.
Advantage: Pittsburgh
Special Teams
Power Play
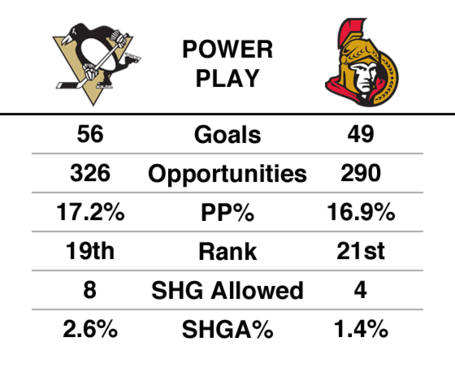
For all the jokes that Senators fans have made this season about the team’s completely inept power play, Pittsburgh’s was just as bad. Where Pittsburgh comes out ahead is that because they’re the higher seed, they get home ice advantage, and the Penguins’ power play runs at 21.0% at home and just 13.4% on the road. It's uneven, but still an advantage.
Pittsburgh has also allowed twice as many shorthanded goals as the Senators, letting in a goal on 2.6% of their power plays.
Advantage: Pittsburgh
Penalty Kill
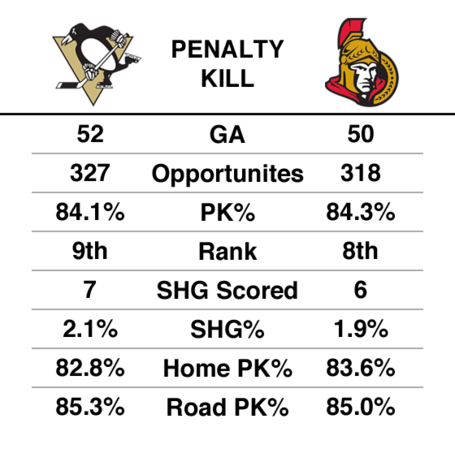
Much like the power play, these two teams are very similar. Their overall kill success rate is about the same, and one team’s road percentage is roughly as good as the home team’s percentage. It’s a duality that gives the impression that no matter where they play, these two teams are essentially equals on the penalty kill.
Advantage: Draw
Season Series
We now move into comparing the teams not by their overall seasons, but how they fared in the four regular season games they played one another in.
Results

Both teams won games 4-1 and both teams won also by a blowout. The first two games were in Ottawa and the second two in Pittsburgh. Both teams were 1-1 at home and on the road.
Advantage: Draw
Forwards
The Penguins have a top-heavy forward corps, but the combination of Crosby, Malkin, Staal, and Guerin combined for only 49% of the team’s goals this season. In the season series against Ottawa, however, Crosby was held without a goal and the Malkin, Staal, and Guerin combination put 10 of the team’s 15 goals on the board. With Crosby contained, the Penguins had to rely on the other three forwards to put up the majority of their offence.
The Penguins were able to shut down Alfredsson, but Fisher and Michalek still put up some respectable numbers. No Senator was able to come close to Evgeni Malkin, whose five goals were more than Spezza, Fisher, and Michalek combined (those five goals were also 18% of his entire season’s totals, which can be taken as either a positive or a negative). That the Senators still scored 13 goals in the four head-to-head games despite their top players not producing as much as the Penguins’ best suggests they have a far more balanced attack.
Interestingly, none of these players scored game-winning goals for their teams.
Advantage: Ottawa, thanks to their balanced attack
Defence
Aside from Gonchar, none of the Penguins’ top four defencemen did much of anything beyond firing pucks blindly into Senators’ goaltenders while stealing all the pluses from Erik Karlsson’s dismal +/- rating. Why is this so significant? Letang and Goligoski are expected to contribute offensively. Volchenkov and Phillips? Not so much. And yet there are Anton Volchenkov, Chris Phillips, and even Andy Sutton, all with even-strength goals. The Senators may be able to keep everyone but Gonchar at bay, but the Penguins can’t seem to keep the sniper that is Chris Philllips from scoring.
Advantage: Ottawa
Pascal Leclaire played the bulk of the minutes early in the season and was flat out embarrassed. His numbers are similar to Brent Johnson’s, except that Johnson’s GAA and save percentage are skewed by his 13 minutes of play, which is something that tends to do damage to your totals. Leclaire played 180 minutes by comparison.
But Leclaire isn’t going to start. Instead, we’ve got the battle of Brian Elliott vs. Marc-Andre Fleury. Elliott’s overall numbers are on par with Fleury’s this season, but Elliott fared much better against Pittsburgh than Fleury did against Ottawa. Elliott’s win came in the eighth game of the 11-game win streak, and he’s played only about a third the number of minutes Fleury has. This one still falls in the favour of Fleury, but only because his credentials are the tiebreaker.
Advantage: Pittsburgh
Penalties
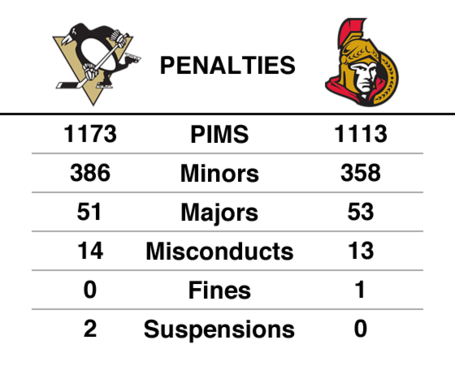
Penalty minutes, minors, and misconducts are slightly titled to Pittsburgh. Majors are slightly tilted towards Ottawa. Matt Cooke and Alexei Ponikarovsky were both suspended for two games, and Jarkko Ruutu was fined for an undisclosed amount. There's potential for some goonery, but it should be pretty even.
Advantage: Draw
And finally...
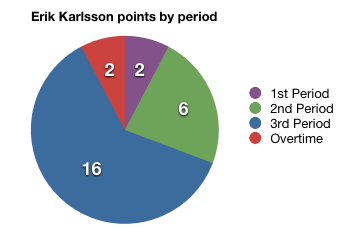
Player to watch: Erik Karlsson
There are plenty of reasons to watch Karlsson, but here’s the biggest reason: do you have any idea how clutch Erik Karlsson is? Here are his numbers broken down by period:
And for good measure, here’s a pie chart: